The University of Arkansas sells about 1.44 car permits for every parking space. We're building a model that decides which permit types each lot should serve, and where each group of drivers should park, to cut walking without sending everyone down the same road.
My part: the dataset. I mapped all 110 lots and 4 garages, estimated each lot's spaces, collected the traffic data, built the interactive campus map, and handled the data requests to Transit & Parking. Ryan and I share the model.
Why it matters
Campus has 14,632 parking spaces. In a 2024 campus survey with more than 5,000 responses, 87.4% of people said they were unsatisfied with parking, and the top complaints were congestion and the walk from parking to class. The university has said it's considering zone-based permits. Our model asks what the best zones would be.
The model
- Decisions: which permit type each lot serves (Commuter, Faculty/Staff or Economy; Resident and Reserved lots stay fixed), and how many people from each group park in each lot.
- Objective: minimize total weighted walking distance from lots to buildings.
- Constraints: everyone gets a place to park; no lot is overfilled, allowing for the fact that not every permit holder is on campus at once; people only park where their permit allows; one permit type per lot.
- Extension: a rush-hour capacity limit on each access road, so the model can't shorten walks by creating a traffic jam.
Building the dataset
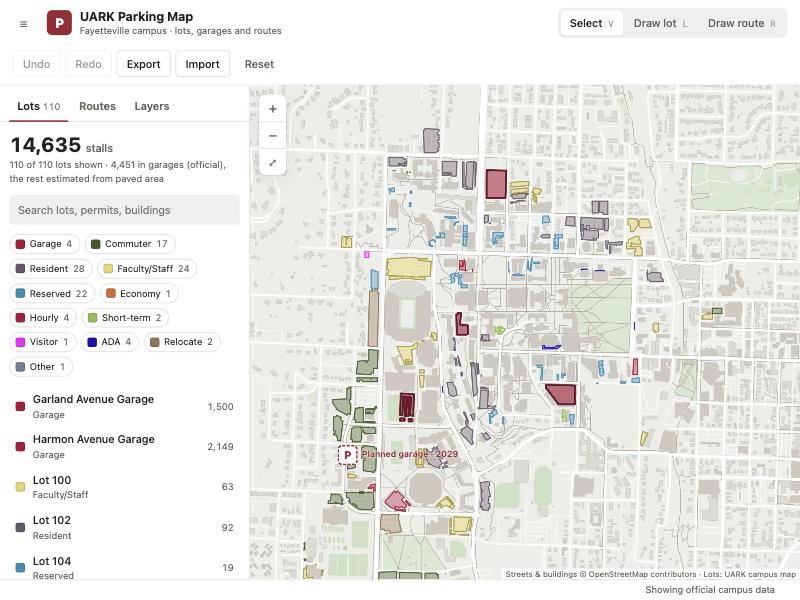
No one publishes how many spaces each lot has, so we built it. I pulled the outline and permit rules of every lot from the university's campus map data, estimated spaces from paved area, and calibrated the estimates so the surface lots add up to the official 10,181. The garages hold 4,451 more, from the university's 2023 garage study.
Cross-checking against the printed parking map settled 8 lots we couldn't read and turned up 37 lots our first inventory had missed.
For traffic, I collected 40 years of daily counts from 103 ArDOT stations around campus and set up the logger that records live road speeds every 30 minutes. It's the same data behind the map on my homepage.
Status
The model was approved at the October milestone. Next come the experiments: today's layout against the optimized one, a tradeoff between student and faculty walking, sensitivity to the space estimates, and a what-if for the planned 1,700-space Razorback Road garage. Results arrive in December.