
Damir Ashinov

Industrial Engineering & Operations Analytics · University of Arkansas · Class of 2028

Damir
Ashinov

I turn messy operational data into decisions: which truck goes where, which lot a commuter should park in, and when the roads into campus jam.

Right now that means campus parking. I built the dataset and the traffic logger behind two team projects this semester, and the map on this page runs on that data.

When do the roads into campus jam?

Measured, not modeled: live TomTom speeds my logger records every 30 minutes.

4:30 pm

Roadspeed vs. normal, 6 am–7:30 pm
Click a road to see its whole day. Weekday averages, 6 am–7:30 pm.

Projects

Fall 2026. Two team projects and the data work underneath them. Each one says what my part was.

Data engineering · Python · GitHub Actions · TomTom API

Campus traffic logger

No public source says how congestion around campus changes through the day, so I built one. Every 30 minutes a script records live speeds on 12 roads into campus, each placed on an Arkansas DOT count station so speeds line up with traffic volumes. It started on my laptop, then moved to a scheduled GitHub Actions job so it runs whether my laptop is open or not.

My part: designed and built the logger, picked and checked the 12 road points, and pulled 40 years of ArDOT counts. Its data drives the map above and HillPark's traffic forecast.
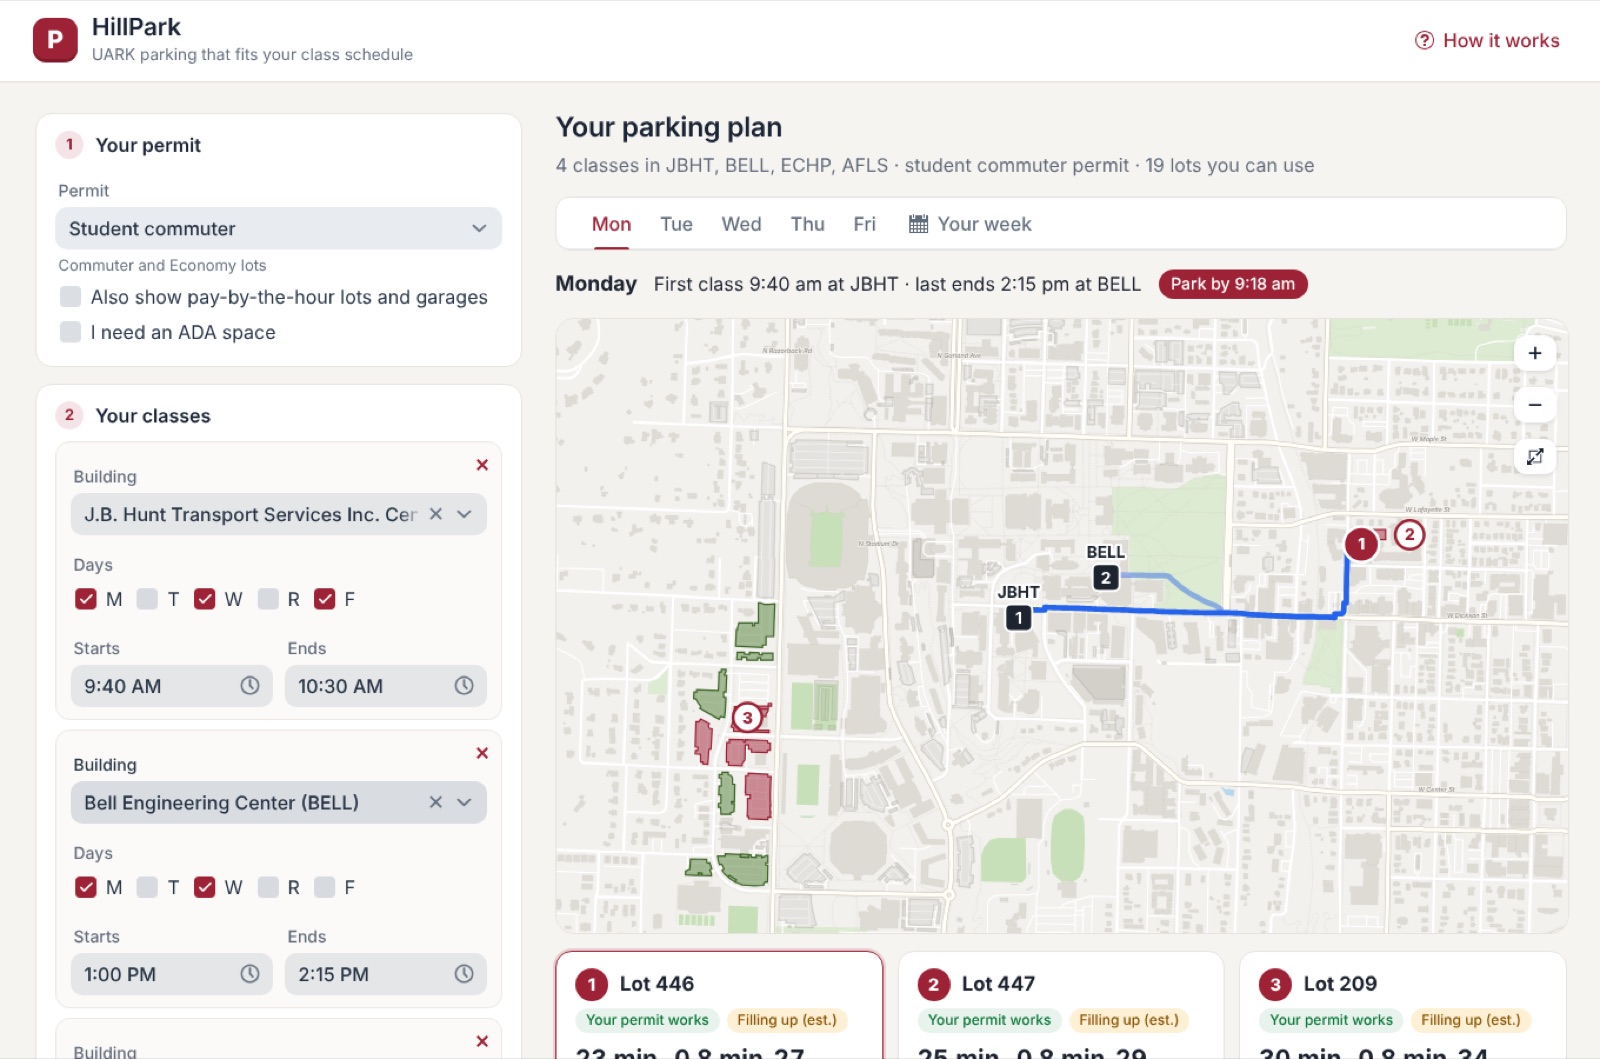
HillPark planning a week of parking for a class schedule

INEG 22203 Computing Methods II · Team of 3

HillPark

A Java web app that tells a student where to park for their class schedule. An OR-Tools integer program picks the best lots for the week; a SMILE model forecasts traffic.

My part: the lot, permit and traffic data it runs on.

Read about HillPark →
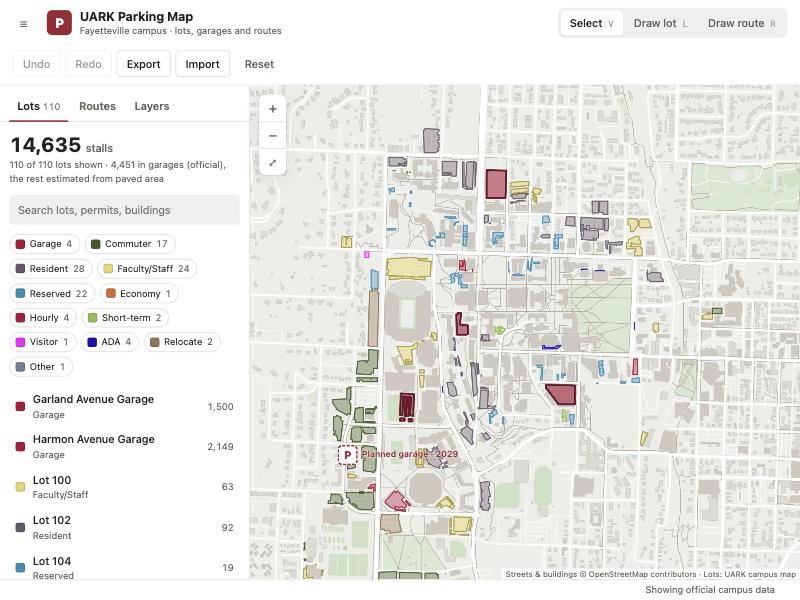
Campus map with every parking lot shaded in UARK's permit colors

INEG 26103 Operations Research · Team of 2

Campus parking permit model

UARK sells about 1.44 car permits per space. A mixed-integer model decides which permit each lot should serve, to shorten walks without sending everyone down the same road.

My part: the 110-lot dataset, the interactive campus map, and the data requests to Transit & Parking.

Read about the model →

Experience

May – July 2025

Marion, Arkansas

Operations Analytics Intern · Merrimack Construction

Ran the hauling logistics for a $1M construction project: which trucks carried what, when, and by which route.

9truck routes, ~30 loads a day
~15%less truck idle time
500deliveries tracked
~$3,500in cost savings found
  • Analyzed routes and material quantities to cut idle time and keep loads moving.
  • Coordinated 9 drivers and 2 site supervisors so concrete, dirt and industrial materials arrived on schedule.
  • Kept delivery and fuel records in Excel, which is where the savings showed up.

Skills & coursework

Methods

  • Linear & integer programming
  • Facility location (p-median)
  • Logistics & supply chain analytics
  • Process improvement
  • Cost analysis
  • Traffic & time-series data

Tools

  • Java
  • R
  • JavaScript
  • AMPL
  • Excel
  • Power BI
  • REST APIs
  • Git & GitHub Actions

Languages & activities

  • English
  • Russian, fluent (state-certified)
  • IISE
  • Chess Club
  • Boxing Club

INEG 26103

Introduction to Operations Research

Linear and integer programming, modeling in AMPL with CPLEX.

INEG 22203

Computing Methods for Industrial Engineers II

Object-oriented Java, Tablesaw, Smile machine learning, OR-Tools, Vaadin.